
Brain Computer Interface MarketSize, Share & Industry Analysis, 2026-2034By ProductBy ApplicationBy ComponentBy End UserBy Technology
Full title & scope — all 5 axes with their segments
Brain Computer Interface Market Size, Share & Industry Analysis, By Product (Invasive Brain Computer Interface, Partially Invasive Brain Computer Interface, Non-Invasive Brain Computer Interface), By Application (Healthcare, Entertainment & Gaming, Communication & Control, Smart Home Control, Brain Function Repair, Disabilities Restoration), By Component (Hardware, Software), By End User (Military, Medical, Manufacturing, Research Center, Others), By Technology (EEG-based, ECoG-based, fNIRS-based, fMRI/MEG-based), and Regional Forecast, 2026-2034
Market outlook, key takeaways, drivers and challenges for the report period.
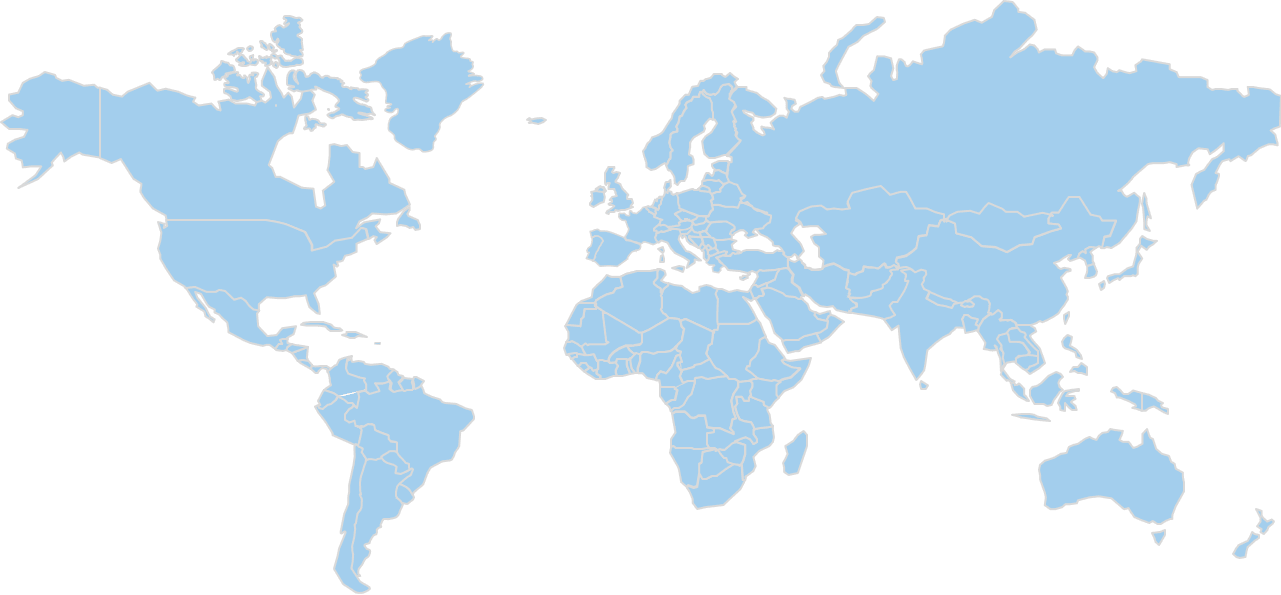
- 01By ProductInvasive Brain Computer Interface · Partially Invasive Brain Computer Interface · Non-Invasive Brain Computer Interface
- 02By ApplicationHealthcare · Entertainment & Gaming · Communication & Control
- 03By ComponentHardware · Software
- 04By End UserMilitary · Medical · Manufacturing
- 05By TechnologyEEG-based · ECoG-based · fNIRS-based
- 06By Region
Market Analysis & Outlook
A brain computer interface is a system that records neural activity and translates it into commands for a computer, prosthesis or other device, or delivers stimulation back to the brain. It takes invasive, partially invasive and non-invasive forms, using electrodes, headsets and imaging sensors together with decoding software. Buyers include hospitals and rehabilitation centres, research institutions, defence and industrial organisations, and consumers using gaming and wellness devices.
USD 2.45 billion of revenue was recorded in the global brain computer interface market in 2025. By 2034 the figure reaches USD 8.25 billion, a compound annual growth rate of 14.36% through the forecast period, along a series that runs USD 1.3 billion in 2020, USD 2.2 billion in 2024, USD 2.82 billion in 2026 and USD 4.93 billion in 2030.
Composition changes more than the total does. Invasive Brain Computer Interface, at 23.5%, outgrows Non-Invasive Brain Computer Interface at 10.7%, and its share moves from 15.5% to 32.7%. Non-Invasive Brain Computer Interface stays the largest line throughout, at USD 1.92 billion in 2025 and USD 4.85 billion in 2034. Invasive Brain Computer Interface and Partially Invasive Brain Computer Interface take share over the period; Non-Invasive Brain Computer Interface give it up while still growing in absolute terms.
The application split puts Healthcare first, at USD 0.9 billion and 36.7% of revenue in 2025, rising to USD 2.75 billion and 33.3% in 2034. Smart Home Control grows faster at 16.7% against 13.2%, moving from 8.2% of revenue to 9.7% by 2034. It cuts the same total as the product axis from a different commercial angle, so revenue does not add across the two.
USD 0.98 billion of 2025 revenue is generated in North America, 40% of the global total and the largest regional share; it reaches USD 2.953 billion by 2034. Asia Pacific is next at 30.5% and USD 0.747 billion, and Latin America last at 2%. Because Asia Pacific, Latin America and Middle East and Africa take share, the revenue added by 2034 concentrates instead of spreading across all five regions.
The 2025 total is a triangulation of published figures and category proxies, short of a directly sourced total. Segment, regional and country splits are estimated on the same basis, which bounds the precision of the figures above. Coverage runs to five regions, three product lines and five segmentation axes across a fifteen-year window.
Market Size, 2020–2034
USD BillionRevenue in USD Billion. Values up to 2025 are actuals; 2026–2034 are forecast.
Key Takeaways
- The global brain computer interface market moves from USD 1.3 billion in 2020 to USD 2.45 billion in 2025 and USD 8.25 billion by 2034, the forecast period compounding at 14.36% a year.
- 78.4% of 2025 revenue sits in Non-Invasive Brain Computer Interface (USD 1.92 billion) and it remains the largest product line in 2034 at USD 4.85 billion and 58.8%.
- Invasive Brain Computer Interface is the fastest-growing line at 23.5%, lifting its share from 15.5% in 2025 to 32.7% in 2034 and its revenue from USD 0.38 billion to USD 2.7 billion.
- Against a base case of USD 8.25 billion in 2034, the study also reports a bear case at USD 6 billion and a bull case at USD 10 billion, with the assumptions behind each set out separately.
- North America holds 40% of global revenue in 2025 at USD 0.98 billion, the largest of the five regions tracked, and reaches USD 2.953 billion by 2034.
- Within North America, the United States is the worked country example, at USD 0.88 billion in 2025; 89.8% of regional revenue in the base year, and USD 2.64 billion by 2034.
- Every line on all five segmentation axes and in each of the five regions carries its own revenue, share and growth rate for all fifteen years, 2020 through 2034, on a 2025 base.
Market Trends
Revenue Share, By by product
Base year 2025Non-Invasive Brain Computer Interface leads with 78.4% of by product segment revenue.
Share of by product segment revenue, most recent base year.
The global brain computer interface market is shaped over 2026-2034 by three measurable movements: a change in the product mix, a shift in where revenue sits geographically, and the 14.36% rate carrying the total.
The direction of the market is not in question in any of the three. Each line and each region grows in revenue terms; what separates them is which takes the larger part of the growth.
The product mix tilts toward Invasive Brain Computer Interface. Invasive Brain Computer Interface grows at 23.5% across 2026-2034 against 10.7% for Non-Invasive Brain Computer Interface, the widest spread on the product axis. Over the forecast period that moves Invasive Brain Computer Interface from 15.5% of revenue to 32.7%, and Non-Invasive Brain Computer Interface from 78.4% to 58.8%. Neither contracts: USD 0.38 billion becomes USD 2.7 billion, USD 1.92 billion becomes USD 4.85 billion. What the spread decides is which of them a supplier's revenue is exposed to.
The regional balance moves. Asia Pacific moves from 30.5% of revenue in 2025 to 36.5% in 2034, worth USD 0.747 billion rising to USD 3.011 billion; Latin America moves from 2% of revenue in 2025 to 2.2% in 2034, worth USD 0.049 billion rising to USD 0.182 billion; Middle East and Africa moves from 3.5% of revenue in 2025 to 3.8% in 2034, worth USD 0.086 billion rising to USD 0.314 billion. Against that, North America at 40% moving to 35.8%, Europe at 24% moving to 21.7%, a fall in share, not in revenue. Revenue added in this market is therefore concentrating geographically instead of spreading evenly, and a participant weighted toward a share-losing region grows more slowly than the market even while its own revenue climbs.
Fifteen years without a discontinuity. Year by year the total runs USD 1.3 billion in 2020, USD 2.2 billion in 2024, USD 2.45 billion in 2025, USD 2.82 billion in 2026, USD 4.93 billion in 2030 and USD 8.25 billion in 2034. Against 13.51% through the historical period, the 14.36% forecast rate is a continuation; no year in the series interrupts it. That moves the planning question away from timing a turn and onto the product and regional mixes, where the actual movement is.
Market Growth Factors
The fastest line decides the blended rate
Market Drivers
3- 01The fastest line decides the blended rate
At 23.5% against a market rate of 14.36%, Invasive Brain Computer Interface is the line pulling the average up: USD 0.38 billion to USD 2.7 billion, and 15.5% of revenue to 32.7%. Set against 10.7% at the other end of the axis, this is the line that decides whether the market's 14.36% holds. A portfolio weighted away from it tracks below the market even in a market growing everywhere.
- 02Growth lands where the revenue already is
North America is the largest region at USD 0.98 billion in 2025, 40% of global revenue, and reaches USD 2.953 billion by 2034 while holding 35.8%. Behind it, Asia Pacific holds 30.5%; USD 0.747 billion rising to USD 3.011 billion. Between them they hold most of the base and most of the revenue added over the period, so equal-weighting the regions in a plan misstates where the growth is.
- 03A demonstrated trajectory, not a projected turnaround
Revenue rose through USD 1.3 billion in 2020, USD 2.2 billion in 2024 and USD 2.45 billion in 2025, a compound 13.51% across the historical period. The forecast period then runs at 14.36%, ending 2034 at USD 8.25 billion. Because the growth is already in the record and not only in the projection, the rate is held flat across the forecast instead of ramped, and the risk in the number sits in the mix assumptions, not in whether the market grows at all.
Growth drivers
| # | Growth driver | Impact | Gross contribution (Billion) | 2026-28 | 2029-31 | 2032-34 |
|---|---|---|---|---|---|---|
| 1 | Clinical progress of implantable systems for paralysis and communication loss | High | +2.3 | Medium | High | High |
| 2 | Lower cost and better capability of consumer and wearable EEG devices | Medium-High | +1.7 | High | Medium | Medium |
| 3 | Neurorehabilitation demand from stroke and spinal cord injury | Medium-High | +1.3 | Medium | High | Medium |
| 4 | Advances in signal decoding software and machine learning | Medium | +0.95 | Medium | Medium | High |
| 5 | Others | Low | +0.85 | Low | Low | Low |
| Total | +7.1 | |||||
Restraints
| # | Restraint | Impact | Estimated reduction (Billion) | 2026-28 | 2029-31 | 2032-34 |
|---|---|---|---|---|---|---|
| 1 | Long regulatory timelines and high clinical trial cost | High | −0.6 | High | Medium | Medium |
| 2 | Surgical risk and limited patient eligibility for implants | Medium | −0.45 | Medium | Medium | Medium |
| 3 | Reimbursement gaps and neural data privacy concerns | Medium | −0.25 | Low | Medium | Medium |
| Total | −1.3 | |||||
Drivers contribute 7.1 Billion and restraints remove 1.3 Billion, a net 5.8 Billion, which is the revenue the market adds between the base year and 2034. Contributions are CDI estimates, apportioned so that they reconcile with the forecast rather than being read from it.
Separate the 14.36% into its parts and three show up: an already-large base compounding, the product mix moving toward its faster lines, and regional growth landing unevenly.
Restraining Factors
The bear case and what drives it
Market Restraints
2- 01The bear case and what drives it
A bear case of USD 6 billion in 2034, against USD 8.25 billion in the base case, rests on one stated assumption: implant clearance slips past the middle of the forecast, safety events or neural data rules slow adoption and consumer demand fades after early interest. Neither case changes the USD 2.45 billion 2025 base.
- 02The largest line is not the fastest
Non-Invasive Brain Computer Interface carries 78.4% of 2025 revenue at USD 1.92 billion but compounds at 10.7% against 14.36% for the market, taking its share to 58.8% by 2034 even as revenue rises to USD 4.85 billion. Because it carries that much of the base, its pace holds the blended rate down more than any faster line lifts it.
Market Opportunities
Where the forecast could be beaten
Market Opportunities
2- 01Where the forecast could be beaten
A first implantable system gains broad US clearance early in the forecast, reimbursement follows quickly and consumer headsets keep adding users. On that assumption the market reaches USD 10 billion by 2034 against USD 8.25 billion in the base case, from the same USD 2.45 billion in 2025.
- 02Invasive Brain Computer Interface share moves from 15.5% to 32.7%
Share on the product axis moves toward Invasive Brain Computer Interface, from 15.5% in 2025 to 32.7% in 2034, on 23.5% growth against the market's 14.36% and revenue rising from USD 0.38 billion to USD 2.7 billion. Taking position there does not require displacing whoever holds Non-Invasive Brain Computer Interface, which is the harder and more expensive fight.
Market Challenges
One product line carries the market
Market Challenges
2- 01One product line carries the market
With 78.4% of 2025 revenue and 58.8% of 2034 revenue (USD 1.92 billion rising to USD 4.85 billion) Non-Invasive Brain Computer Interface is where the market's exposure sits. That concentration means the market's own forecast is, to a large extent, a forecast for one product line.
- 02North America is largely the United States
The United States generates USD 0.88 billion of North America's USD 0.98 billion in 2025, 89.8% of the region, reaching USD 2.64 billion by 2034. Read as a region it looks diversified; read by weight it is not, and the regional forecast inherits whatever happens in that one market.
Segmentation Analysis
5 axesfive segmentation axes are reported; by product, by application, component, end user and technology. Revenue does not add across them: each is a different cut of the same total.
Three product lines are reported. Two of them take share over the forecast period and the other gives it up, though every line grows in absolute terms between 2025 and 2034.
By Product · 3 segments
Scale in Non-Invasive Brain Computer Interface and Growth in Invasive Brain Computer Interface Define the Product Axis
- Largest Non-Invasive Brain Computer Interface · 78.4%
- Fastest Invasive Brain Computer Interface · 23.5%
- Moves most Non-Invasive Brain Computer Interface · -19.6 pts
- Order by 2034 unchanged
| Segment | 2025 | Share | 2034 | Share | CAGR |
|---|---|---|---|---|---|
| Invasive Brain Computer Interface | $0.38B | 15.5% | $2.70B | 32.7%+17.2 | 23.5% |
| Partially Invasive Brain Computer Interface | $0.15B | 6.1% | $0.70B | 8.5%+2.4 | 19.4% |
| Non-Invasive Brain Computer Interface | $1.92B | 78.4% | $4.85B | 58.8%-19.6 | 10.7% |
Non-invasive systems lead because they need no surgery, are sold to clinics, laboratories and consumers, and carry lower prices that suit wide purchasing. Invasive systems grow fastest as trials move toward clearance and each implant generates high-value hardware and service revenue, while partially invasive systems start small and gain as electrode designs reduce surgical risk. The order does not change: Non-Invasive Brain Computer Interface is still largest in 2034, and what moves is how much it holds. This is the axis the estimation prices in full, year by year, and the one the regional chapters cut against.
By Application · 6 segments
Scale in Healthcare and Growth in Smart Home Control Define the Application Axis
- Largest Healthcare · 36.7%
- Fastest Smart Home Control · 16.7%
- Moves most Healthcare · -3.4 pts
- Order by 2034 changes
| Segment | 2025 | Share | 2034 | Share | CAGR |
|---|---|---|---|---|---|
| Healthcare | $0.90B | 36.7% | $2.75B | 33.3%-3.4 | 13.2% |
| Entertainment & Gaming | $0.42B | 17.1% | $1.35B | 16.4%-0.7 | 13.9% |
| Communication & Control | $0.37B | 15.1% | $1.30B | 15.8%+0.7 | 15% |
| Smart Home Control | $0.20B | 8.2% | $0.80B | 9.7%+1.5 | 16.7% |
| Brain Function Repair | $0.33B | 13.5% | $1.25B | 15.1%+1.6 | 16% |
| Disabilities Restoration | $0.23B | 9.4% | $0.80B | 9.7%+0.3 | 14.9% |
Healthcare leads because clinical buyers pay for diagnostics, monitoring and therapy tied to neurological conditions. Smart home control grows fastest from a small base as assistive and consumer devices connect to household equipment, with brain function repair close behind as stroke rehabilitation programmes adopt interface-driven training. By 2034 Healthcare is still ahead, making this a shift in weight, not a change of leader.
By Component · 2 segments
Hardware Held the Dominant Share of the Component Segment in 2025
- Largest Hardware · 66.1%
- Fastest Software · 16.6%
- Moves most Hardware · -6.1 pts
- Order by 2034 unchanged
| Segment | 2025 | Share | 2034 | Share | CAGR |
|---|---|---|---|---|---|
| Hardware | $1.62B | 66.1% | $4.95B | 60%-6.1 | 13.2% |
| Software | $0.83B | 33.9% | $3.30B | 40%+6.1 | 16.6% |
Hardware leads because every deployment needs electrodes, amplifiers, headsets or implants, and these carry most of the revenue today. Software grows faster as decoding, signal processing and neurofeedback platforms are sold as licences and subscriptions on top of installed devices, and as machine learning improves the accuracy of control. The fastest line is Software, which is why the split shifts toward it over the period. The order does not change: Hardware is still largest in 2034, and what moves is how much it holds.
By End User · 5 segments
Scale in Medical and Growth in Manufacturing Define the End user Axis
- Largest Medical · 44.9%
- Fastest Manufacturing · 20.6%
- Moves most Research Center · -6.9 pts
- Order by 2034 changes
| Segment | 2025 | Share | 2034 | Share | CAGR |
|---|---|---|---|---|---|
| Military | $0.18B | 7.3% | $0.80B | 9.7%+2.4 | 18% |
| Medical | $1.10B | 44.9% | $3.55B | 43%-1.9 | 13.9% |
| Manufacturing | $0.12B | 4.9% | $0.65B | 7.9%+3 | 20.6% |
| Research Center | $0.60B | 24.5% | $1.45B | 17.6%-6.9 | 10.3% |
| Others (Gaming and Communication) | $0.45B | 18.4% | $1.80B | 21.8%+3.4 | 16.7% |
Medical buyers lead because hospitals and clinics purchase devices for diagnosis, rehabilitation and communication support. Manufacturing grows fastest from a small base as employers test attention and fatigue monitoring and hands-free control, and military programmes follow as defence research funds neural interfaces for operators. The order does not change: Medical is still largest in 2034, and what moves is how much it holds.
By Technology · 4 segments
ECoG-based Outpaces the Axis While EEG-based Holds the Largest Share
- Largest EEG-based · 75.5%
- Fastest ECoG-based · 22.7%
- Moves most ECoG-based · +13.6 pts
- Order by 2034 unchanged
| Segment | 2025 | Share | 2034 | Share | CAGR |
|---|---|---|---|---|---|
| EEG-based | $1.85B | 75.5% | $5.30B | 64.3%-11.2 | 12.4% |
| ECoG-based | $0.38B | 15.5% | $2.40B | 29.1%+13.6 | 22.7% |
| fNIRS-based | $0.14B | 5.7% | $0.35B | 4.2%-1.5 | 10.7% |
| fMRI/MEG-based | $0.08B | 3.3% | $0.20B | 2.4%-0.9 | 10.7% |
EEG-based systems lead because they are non-invasive, low cost and used across clinics, laboratories and consumer devices. ECoG-based systems grow fastest because they sit on the brain surface to give higher signal quality for implants moving through clinical programmes. fNIRS and fMRI or MEG systems serve niche research settings with slower growth. By 2034 EEG-based is still ahead, making this a shift in weight, not a change of leader.
Regional Insights
Regional Revenue Share
Base year 2025Share of global revenue in the base year.
Only the leading region's share is published outside the report; pins mark the region, not a specific country.
North America Market Analysis
The largest region covered — 4.2 points of share move elsewhere by 2034, while revenue still grows 3.0×.
- Rank 1 of 5
- 2025 share 40%
- By 2034 35.8%
- Revenue $0.98B → $2.95B
USD 0.98 billion of 2025 revenue is generated in North America, 40% of the global brain computer interface market on the way to USD 2.953 billion by 2034. It is a dominant region on this axis, first by revenue throughout the period.
Share settles at 35.8% in 2034, a shift in share, not in direction: revenue climbs every year while the market's centre of gravity moves elsewhere.
Within the region the product split tracks the global one; 78.4% of 2025 revenue in Non-Invasive Brain Computer Interface, fastest growth of 23.5% in Invasive Brain Computer Interface. North America is reported axis by axis and country by country in the full study.
United States
Sets the pace for North America at 89.8% of it, growing 3.0×.
- In region 1 of 2
- Of region 89.8%
- Of global 35.9%
- Revenue $0.88B → $2.64B
89.8% of North America's base-year revenue comes from the United States; USD 0.88 billion, rising to USD 2.64 billion by 2034. Because it is 89.8% of the region in the base year, North America's totals move with this one country instead of a spread of them. Regional revenue of USD 0.98 billion in 2025 and USD 2.953 billion in 2034 sits around it, and it is the country used wherever the full report cuts a figure by geography.
the United States buys along the same lines as the market globally; Non-Invasive Brain Computer Interface first at 78.4% of 2025 revenue and 58.8% in 2034, Invasive Brain Computer Interface fastest at 23.5% on a share moving from 15.5% to 32.7%. Since 89.8% of North America's revenue is generated here, the regional numbers inherit this market's mix instead of smoothing it out. Revenue by product for the United States is reported separately in the full report.
In the United States, brain computer interfaces intended for medical use are regulated as medical devices by the Food and Drug Administration. Implanted systems typically fall into the highest risk class and go through premarket approval, while novel lower-risk devices may use the De Novo pathway. Developers of implants usually need an investigational device exemption before running clinical studies, with institutional review board oversight. Suppliers must maintain a quality system under the agency's device regulation, report adverse events, and follow labelling and cybersecurity expectations for connected software. Consumer neurotechnology sold for wellness without medical claims sits outside this route, though marketing claims are still scrutinised.
In the United States the field is Natus Medical Incorporated, tec medical engineering GmbH, Medtronic, Compumedics Neuroscan, Brain Products GmbH, Integra Lifesciences Corporation, Advanced Brain Monitoring, Inc., EMOTIV, NeuroSky, Interaxon, Inc., ANT Neuro, Neuroelectrics, Ripple Neuro, NIRx Medical Technologies, LLC, OpenBCI and CGX, A Cognionics Company. Non-Invasive Brain Computer Interface, at 78.4% of 2025 revenue, is where the volume sits, and Invasive Brain Computer Interface, growing at 23.5%, is where position changes hands over the forecast period. Per-company positioning and share at country level are in the full report only.
Canada
2nd-largest in North America, growing 3.2×.
- In region 2 of 2
- Of region 8.7%
- Of global 3.5%
- Revenue $0.09B → $0.27B
Canada is sized at USD 0.085 billion in 2025, rising to USD 0.27 billion by 2034; 3.5% of global revenue and 8.7% of North America. It is reported separately from the United States across every segmentation axis in the full report.
Europe Market Analysis
The 3rd-largest region covered — 2.3 points of share move elsewhere by 2034, while revenue still grows 3.0×.
- Rank 3 of 5
- 2025 share 24%
- By 2034 21.7%
- Revenue $0.59B → $1.79B
Europe holds 24% of the global brain computer interface market in 2025, worth USD 0.588 billion on the way to USD 1.79 billion by 2034. Among the five regions it ranks third by revenue in both years.
Share settles at 21.7% in 2034, a shift in share, not in direction: revenue climbs every year while the market's centre of gravity moves elsewhere.
Non-Invasive Brain Computer Interface leads here as it does globally, at 78.4% of 2025 revenue, and Invasive Brain Computer Interface again grows fastest at 23.5%. Revenue for Europe is broken out by every segmentation axis and by country in the full report.
Germany
The largest market in Europe, growing 3.1×.
- In region 1 of 3
- Of region 25.5%
- Of global 6.1%
- Revenue $0.15B → $0.46B
25.5% of Europe's base-year revenue comes from Germany; USD 0.15 billion, rising to USD 0.46 billion by 2034. Its 25.5% of base-year regional revenue leads the region, though enough sits elsewhere that Europe is not a proxy for it. Against regional totals of USD 0.588 billion in 2025 and USD 1.79 billion in 2034, it is the country the full report breaks out in detail.
Germany buys along the same lines as the market globally; Non-Invasive Brain Computer Interface first at 78.4% of 2025 revenue and 58.8% in 2034, Invasive Brain Computer Interface fastest at 23.5% on a share moving from 15.5% to 32.7%. Its 25.5% weight in Europe means those movements carry straight into the regional totals. Germany carries its own product breakdown in the full report.
Germany applies the European Union Medical Device Regulation, so a brain computer interface for clinical use must carry CE marking issued after assessment by a notified body. Active implantable devices follow the most demanding conformity route, which includes clinical evaluation, a quality management system and technical documentation. The Federal Institute for Drugs and Medical Devices acts as the national competent authority, handling vigilance reports and oversight of clinical investigations alongside ethics committees. Suppliers must follow harmonised standards for electrical safety, biocompatibility, software lifecycle and risk management, and meet the General Data Protection Regulation where neural data counts as health information. Labelling must include unique device identification and instructions in German.
The suppliers tracked in this study (Natus Medical Incorporated, tec medical engineering GmbH, Medtronic, Compumedics Neuroscan, Brain Products GmbH, Integra Lifesciences Corporation, Advanced Brain Monitoring, Inc., EMOTIV, NeuroSky, Interaxon, Inc., ANT Neuro, Neuroelectrics, Ripple Neuro, NIRx Medical Technologies, LLC, OpenBCI and CGX, A Cognionics Company) compete in Germany across the product lines above. Volume sits in Non-Invasive Brain Computer Interface at 78.4% of 2025 revenue; movement sits in Invasive Brain Computer Interface at 23.5% growth. A supplier weighted toward Europe is competing over a base of USD 0.588 billion in 2025 reaching USD 1.79 billion by 2034, 24% of global revenue at the start of that period.
United Kingdom
2nd-largest in Europe, growing 3.1×.
- In region 2 of 3
- Of region 22.1%
- Of global 5.3%
- Revenue $0.13B → $0.40B
5.3% of global revenue is generated in the United Kingdom; USD 0.13 billion in 2025, reaching USD 0.4 billion in 2034, and 22.1% of Europe.
France
3rd-largest in Europe, growing 3.2×.
- In region 3 of 3
- Of region 14.5%
- Of global 3.5%
- Revenue $0.09B → $0.27B
3.5% of global revenue is generated in France; USD 0.085 billion in 2025, reaching USD 0.27 billion in 2034, and 14.5% of Europe.
Asia Pacific Market Analysis
The 2nd-largest region covered, and the one gaining the most — it picks up 6 points of share by 2034, while revenue still grows 4.0×.
- Rank 2 of 5
- 2025 share 30.5%
- By 2034 36.5%
- Revenue $0.75B → $3.01B
30.5% of the global brain computer interface market sits in Asia Pacific in 2025, worth USD 0.747 billion with USD 3.011 billion projected for 2034. By revenue it sits second across the study, and the ranking does not change between 2025 and 2034.
36.5% of global revenue sits here by 2034, up from the 2025 level, so the region grows faster than the market's 14.36% and takes a larger part of the revenue added by 2034 than its 2025 weight implies.
Within the region the product split tracks the global one; 78.4% of 2025 revenue in Non-Invasive Brain Computer Interface, fastest growth of 23.5% in Invasive Brain Computer Interface. Per-axis and per-country detail for Asia Pacific sits in the full report.
China
The largest market in Asia Pacific, growing 4.3×.
- In region 1 of 3
- Of region 38.8%
- Of global 11.8%
- Revenue $0.29B → $1.25B
The largest single market in Asia Pacific is China, at USD 0.29 billion in 2025 and USD 1.25 billion in 2034. At 38.8% of the region in 2025 it leads, but a majority of Asia Pacific's revenue is generated in other markets. Regional revenue of USD 0.747 billion in 2025 and USD 3.011 billion in 2034 sits around it, and it is the country used wherever the full report cuts a figure by geography.
Demand in China follows the product mix reported at global level: Non-Invasive Brain Computer Interface is the largest line at 78.4% of 2025 revenue, moving to 58.8% by 2034, while Invasive Brain Computer Interface grows fastest at 23.5% and takes its share from 15.5% to 32.7%. With 38.8% of Asia Pacific concentrated here, a change in this country's mix is visible in the regional figures instead of being diluted by its neighbours. Revenue by product for China is reported separately in the full report.
In China, brain computer interfaces are regulated as medical devices by the National Medical Products Administration. Implantable products are classed in the highest risk category and need registration backed by type testing at an accredited institute and clinical evaluation, often including trials in China. Innovative devices can use a priority review channel for breakthrough products. Suppliers must hold manufacturing licences, operate a quality system aligned with national good manufacturing practice for devices, and label products in Chinese. Data security and personal information laws also apply to neural and health data, and cross-border transfer of such data faces additional controls.
Competition in China runs between the suppliers this study tracks: Natus Medical Incorporated, tec medical engineering GmbH, Medtronic, Compumedics Neuroscan, Brain Products GmbH, Integra Lifesciences Corporation, Advanced Brain Monitoring, Inc., EMOTIV, NeuroSky, Interaxon, Inc., ANT Neuro, Neuroelectrics, Ripple Neuro, NIRx Medical Technologies, LLC, OpenBCI and CGX, A Cognionics Company. Two different problems sit on the same axis: holding Non-Invasive Brain Computer Interface at 78.4% of 2025 revenue, and taking Invasive Brain Computer Interface while it grows at 23.5%. The commercial size of that position is USD 0.747 billion in 2025, moving to USD 3.011 billion by 2034 across the forecast period.
Japan
2nd-largest in Asia Pacific, growing 3.7×.
- In region 2 of 3
- Of region 20.1%
- Of global 6.1%
- Revenue $0.15B → $0.55B
Within Asia Pacific, Japan accounts for 20.1% of regional revenue and 6.1% of the global total, worth USD 0.15 billion in 2025 and USD 0.55 billion by 2034.
South Korea
3rd-largest in Asia Pacific, growing 4.0×.
- In region 3 of 3
- Of region 10%
- Of global 3.1%
- Revenue $0.07B → $0.30B
3.1% of global revenue is generated in South Korea; USD 0.075 billion in 2025, reaching USD 0.3 billion in 2034, and 10% of Asia Pacific.
Latin America Market Analysis
The 5th-largest region covered — it picks up 0.2 points of share by 2034, while revenue still grows 3.7×.
- Rank 5 of 5
- 2025 share 2%
- By 2034 2.2%
- Revenue $0.05B → $0.18B
2% of the global brain computer interface market sits in Latin America in 2025, worth USD 0.049 billion with USD 0.182 billion projected for 2034. Among the five regions it ranks fifth by revenue in both years.
By 2034 the share has moved up to 2.2%, on growth above the market's own 14.36%, and with a bigger contribution to the revenue added over the period than the base-year figure suggests.
Within the region the product split tracks the global one; 78.4% of 2025 revenue in Non-Invasive Brain Computer Interface, fastest growth of 23.5% in Invasive Brain Computer Interface. Latin America is reported axis by axis and country by country in the full study.
Brazil
The largest market in Latin America, growing 3.6×.
- In region 1 of 2
- Of region 51%
- Of global 1%
- Revenue $0.03B → $0.09B
Brazil is the largest market within Latin America, generating USD 0.025 billion in 2025 and projected to reach USD 0.09 billion by 2034. 51% of the region in the base year makes it the largest market here without making it the region. Set against USD 0.049 billion and USD 0.182 billion for the region, it is why this market, and not a smaller one, is the one reported in full.
Composition here matches the global split: the largest line is Non-Invasive Brain Computer Interface at 78.4% of 2025 revenue, easing to 58.8% by 2034, and the fastest is Invasive Brain Computer Interface at 23.5%, from 15.5% to 32.7%. Because the country carries 51% of Latin America, a movement in its own mix shows up in the regional totals instead of being averaged away by neighbouring markets. Revenue by product for Brazil is reported separately in the full report.
Brazil regulates brain computer interfaces as medical devices through the national health surveillance agency, ANVISA. Products are assigned a risk class, and implantable or high-risk systems require full registration supported by technical dossiers and clinical evidence, while lower-risk devices follow a notification route. Manufacturers must hold a certificate of good manufacturing practice, and foreign suppliers need a local registration holder. Electrical medical equipment generally has to be certified under the national conformity assessment system through an accredited body. Labels and instructions must appear in Portuguese, and the general data protection law applies to any neural or health information collected by the device.
The suppliers tracked in this study (Natus Medical Incorporated, tec medical engineering GmbH, Medtronic, Compumedics Neuroscan, Brain Products GmbH, Integra Lifesciences Corporation, Advanced Brain Monitoring, Inc., EMOTIV, NeuroSky, Interaxon, Inc., ANT Neuro, Neuroelectrics, Ripple Neuro, NIRx Medical Technologies, LLC, OpenBCI and CGX, A Cognionics Company) compete in Brazil across the product lines above. The commercially relevant division is 78.4% of 2025 revenue in Non-Invasive Brain Computer Interface, where the volume is, against 23.5% growth in Invasive Brain Computer Interface, where share moves. The commercial size of that position is USD 0.049 billion in 2025 and USD 0.182 billion by 2034, 2% of the global total in the base year.
Mexico
2nd-largest in Latin America, growing 3.8×.
- In region 2 of 2
- Of region 24.5%
- Of global 0.5%
- Revenue $0.01B → $0.04B
0.5% of global revenue is generated in Mexico; USD 0.012 billion in 2025, reaching USD 0.045 billion in 2034, and 24.5% of Latin America.
Middle East and Africa Market Analysis
The 4th-largest region covered — it picks up 0.3 points of share by 2034, while revenue still grows 3.7×.
- Rank 4 of 5
- 2025 share 3.5%
- By 2034 3.8%
- Revenue $0.09B → $0.31B
Middle East and Africa holds 3.5% of the global brain computer interface market in 2025, worth USD 0.086 billion rising to USD 0.314 billion in 2034. That makes it the fourth-largest region covered, in 2025 and again in 2034.
By 2034 the share has moved up to 3.8%, at a pace above the 14.36% global rate, so this region warrants separate treatment and should not be scaled off the total.
The product mix reported at global level applies here, with Non-Invasive Brain Computer Interface the largest line at 78.4% of 2025 revenue and Invasive Brain Computer Interface the fastest-growing at 23.5%. Per-axis and per-country detail for Middle East and Africa sits in the full report.
Israel
The largest market in Middle East and Africa, growing 3.8×.
- In region 1 of 3
- Of region 23.3%
- Of global 0.8%
- Revenue $0.02B → $0.07B
The largest single market in Middle East and Africa is Israel, at USD 0.02 billion in 2025 and USD 0.075 billion in 2034. At 23.3% of the region in 2025 it leads, but a majority of Middle East and Africa's revenue is generated in other markets. Regional revenue of USD 0.086 billion in 2025 and USD 0.314 billion in 2034 sits around it, and it is the country used wherever the full report cuts a figure by geography.
Composition here matches the global split: the largest line is Non-Invasive Brain Computer Interface at 78.4% of 2025 revenue, easing to 58.8% by 2034, and the fastest is Invasive Brain Computer Interface at 23.5%, from 15.5% to 32.7%. Since 23.3% of Middle East and Africa's revenue is generated here, the regional numbers inherit this market's mix instead of smoothing it out. The full report reports Israel by product separately.
In Israel, medical devices are regulated by the Medical Devices Division of the Ministry of Health, which maintains the national register of devices. A brain computer interface must be registered before it is marketed, and the ministry commonly relies on approvals from recognised foreign regulators, such as CE marking or clearance from the United States agency, as supporting evidence. Higher-risk implanted devices attract closer review, and clinical studies need approval from a hospital ethics committee and the ministry. Local importers or authorised representatives hold responsibility for registration, adverse event reporting and field actions. Labelling must be available in Hebrew, and privacy law covers sensitive neural and health data.
Natus Medical Incorporated, tec medical engineering GmbH, Medtronic, Compumedics Neuroscan, Brain Products GmbH, Integra Lifesciences Corporation, Advanced Brain Monitoring, Inc., EMOTIV, NeuroSky, Interaxon, Inc., ANT Neuro, Neuroelectrics, Ripple Neuro, NIRx Medical Technologies, LLC, OpenBCI and CGX, A Cognionics Company are the suppliers covered in Israel. Non-Invasive Brain Computer Interface, at 78.4% of 2025 revenue, is where the volume sits, and Invasive Brain Computer Interface, growing at 23.5%, is where position changes hands over the forecast period. The commercial size of that position is USD 0.086 billion in 2025 and USD 0.314 billion by 2034, 3.5% of the global total in the base year.
United Arab Emirates
2nd-largest in Middle East and Africa, growing 4.0×.
- In region 2 of 3
- Of region 17.4%
- Of global 0.6%
- Revenue $0.01B → $0.06B
The United Arab Emirates is sized at USD 0.015 billion in 2025, rising to USD 0.06 billion by 2034; 0.6% of global revenue and 17.4% of Middle East and Africa. It is reported separately from Israel across every segmentation axis in the full report.
Saudi Arabia
3rd-largest in Middle East and Africa, growing 4.2×.
- In region 3 of 3
- Of region 14%
- Of global 0.5%
- Revenue $0.01B → $0.05B
Within Middle East and Africa, Saudi Arabia accounts for 14% of regional revenue and 0.5% of the global total, worth USD 0.012 billion in 2025 and USD 0.05 billion by 2034.
Download a free sample to see the full data tables and segment-level detail behind this analysis.
Report Coverage
This report assesses the market across every segment, with revenue and a growth rate for each line in each year of the study period. It covers the drivers, trends, opportunities, restraints and challenges shaping growth, the competitive landscape and the companies profiled, and the research methodology behind every estimate. Segmentation is reported by product, application, component, end user, technology, and regional analysis covers North America, Europe, Asia Pacific, Latin America, Middle East and Africa, each broken out by country.
Competitive Landscape
Position on the Product Axis Decides Competitive Standing
Suppliers in scope: Natus Medical Incorporated, tec medical engineering GmbH, Medtronic, Compumedics Neuroscan, Brain Products GmbH, Integra Lifesciences Corporation, Advanced Brain Monitoring, Inc., EMOTIV, NeuroSky, Interaxon, Inc., ANT Neuro, Neuroelectrics, Ripple Neuro, NIRx Medical Technologies, LLC, OpenBCI and CGX, A Cognionics Company.
The competitive line that matters is the product one, not the geographic one. The largest block of revenue is Non-Invasive Brain Computer Interface: USD 1.92 billion in 2025 at 78.4% of the total, 58.8% in 2034. Incumbency there is expensive to challenge. The line that changes hands is Invasive Brain Computer Interface at 23.5%, well ahead of Non-Invasive Brain Computer Interface at 10.7%. Those are different problems, and a supplier strong in one is not thereby strong in the other; that is what sustains a field this size in a USD 2.45 billion market.
Suppliers compete on signal quality, regulatory experience, clinical evidence and the breadth of their software. Larger players hold advantages in clearance history, hospital relationships, service networks and the ability to fund long implant trials. They can also bundle amplifiers, electrodes and analysis software for research and clinical buyers. Smaller and regional suppliers compete on price, open or flexible platforms, niche applications such as gaming or education, and speed of product launches. In implantable systems, surgical training, manufacturing quality and long-term safety data decide who reaches commercial scale, and access to specialist centres limits how fast new entrants can grow.
Presence matters unevenly by region. With 40% of 2025 revenue in North America and 30.5% in Asia Pacific, a supplier's coverage of those two decides most of its addressable base before any product question arises.
Company-level profiles, financials, shares and development histories are held in the full report and not in this summary.
List of Key Brain Computer Interface Market Companies Profiled
16 companies profiled. Company profiles, including financials, product portfolios and recent developments, are part of the full report.
- Natus Medical Incorporated(United States)
- tec medical engineering GmbH(Austria)
- Medtronic(Ireland)
- Compumedics Neuroscan(Australia)
- Brain Products GmbH(Germany)
- Integra Lifesciences Corporation(United States)
- Advanced Brain Monitoring, Inc.(United States)
- EMOTIV(United States)
- NeuroSky(United States)
- Interaxon, Inc.(Canada)
- ANT Neuro(Netherlands)
- Neuroelectrics(Spain)
- Ripple Neuro(United States)
- NIRx Medical Technologies, LLC
- OpenBCI(United States)
- CGX, A Cognionics Company(United States)
Geographic Coverage
Every market below is broken out separately in the report.
North America
3Europe
8Asia Pacific
12Latin America
3Middle East and Africa
4Key Insights
Report Scope
Study parameters & segmentationThis study covers market size and forecasts over the 2020–2034 period, segmentation across 5 axes (Product, Application, Component, End User, Technology), regional analysis for 5 regions and their constituent countries, a competitive landscape profiling 16 key companies, and the research methodology behind every estimate.
Segmentation
5 axes + regionQuestions This Report Answers
6 questionsWhat is the market size and growth rate, globally and by region?
How is the market segmented, and which segments lead?
Which regions and countries are covered, and how do they compare?
What are the key drivers, restraints, opportunities and challenges?
Who are the leading companies operating in this market?
What trends are expected to shape the market through the forecast period?
Frequently Asked Questions
01What is the Brain Computer Interface Market projected to reach?
USD 8.25 Billion by 2034, CAGR 14.36%
02What years does this report cover?
Study period 2020–2034, base year 2025, historical data 2020-2024, forecast period 2026-2034.
03Which regions are covered?
North America, Europe, Asia Pacific, Latin America, Middle East and Africa.
04Which region accounted for the largest market share?
North America leads with 40% of global revenue through 2034.
05Which segment leads the market?
Non-Invasive Brain Computer Interface is the largest line by product, at 78.4% of revenue in 2025.
06Who are the key companies profiled?
Natus Medical Incorporated, tec medical engineering GmbH, Medtronic, Compumedics Neuroscan, Brain Products GmbH, Integra Lifesciences Corporation, Advanced Brain Monitoring, Inc., EMOTIV, NeuroSky, Interaxon, Inc., ANT Neuro, Neuroelectrics, Ripple Neuro, NIRx Medical Technologies, LLC, OpenBCI, CGX, A Cognionics Company. Full profiles are part of the paid report.
07Can the segmentation be customized?
Yes. Custom data cuts by geography, segment, or competitor set are available on request.
Why choose CDI
Need this report shaped around your question?
The scope isn't fixed. Tell us what your team needs that the standard edition doesn't cover, and an analyst will come back on what can be adjusted and how long it takes, before you commit to anything.
Most licences include 30–60 hours of customization at no extra cost. See what each licence includes
Additional Companies
Add competitors, suppliers or the peer set you benchmark against to the companies already covered.
Deeper Competitive View
Sharpen the landscape work around your own position: product line, channel, or a named shortlist of rivals.
Extra Segment Splits
Break the market down along an axis the standard scope doesn't cut it by, or go a level deeper inside one.
Application Focus
Narrow the analysis to the specific use cases and end users your team actually sells into.
Different Time Frame
Move the base year, or widen the historical and forecast windows the study is built on.
Country-Level Detail
Go below region level into the individual countries that matter to you, rather than the standard geography split.